Recently I’ve been asked to create a dashboard in Grafana, displaying the power usage of the Smart PDU Sentry3.
Although most of the modern systems have a metric page or a written exporter, which can be simply gathered by Prometheus, most of the old systems or devices are still answering SNMP queries and do not have exposed metrics or an exporter.
In this situation we can use the Prometheus SNMP exporter, which acts like a proxy between Prometheus and the SNMP device. The Prometheus SNMP exporter exposed metrics to the Prometheus server based on the SNMP queries to the requested device.
To gather metrics from the device, we need to know OIDs, which represent the specific parameters. For example, you can find the OID tree for Sentry 3 PDU here.
For example, in Sentry 3 PDU, OID .1.3.6.1.4.1.1718.3.1.6.0 represents the systemTotalPower parameter, which I need to put on a graph.
Using the snmpget command, you can simply request a required OID:
snmpget -v2c -c public 192.168.1.30 .1.3.6.1.4.1.1718.3.1.6.0
iso.3.6.1.4.1.1718.3.1.6.0 = INTEGER: 1075
As a result, we can see that the systemTotalPower (1.3.6.1.4.1.1718.3.1.6.0) of the device 192.168.1.30 is 1075 watts.
Now let’s install Prometheus SNMP Exporter. In the Ubuntu OS, it can be done with one command:
sudo apt install prometheus-snmp-exporterNow edit the config file, located at /etc/prometheus/snmp.yml:
sudo vi /etc/prometheus/snmp.yml

auths:
  public_v2:
    community: public
    security_level: noAuthNoPriv
    auth_protocol: MD5
    priv_protocol: DES
    version: 2
modules:
  sentry3:
    walk:
    - 1.3.6.1.4.1.1718.3.1.6.0  # systemTotalPower
    metrics:
    - name: sentry3_total_power_watts
      oid: 1.3.6.1.4.1.1718.3.1.6.0
      type: gauge
      help: "Total power consumption of Sentry PDU"
In this example we created a module called “sentry3”. This module will walk through the required OIDs, in my case only one. SNMP authentication can be adjusted in the auth section.
The module will expose only one metric, called sentry3_total_power_watts, which will represent the 1.3.6.1.4.1.1718.3.1.6.0 OID’s value.
Save the file, and enable (or restart) prometheus-snmp-exporter:
sudo systemctl enable --now prometheus-snmp-exporterNow the exporter is running on the port 9116 and ready to answer. For example, you can open it using a browser and request metrics:
http://192.168.0.162:9116/snmp?target=192.168.1.30&module=sentry3

# HELP sentry3_total_power_watts Total power consumption of Sentry CDU
# TYPE sentry3_total_power_watts gauge
sentry3_total_power_watts 1075
...
In the URL above, we’re using the IP address of the device and specifying the module we want to use against this device. Target: 192.168.1.30, module: sentry3 (as it called in the snmp.yml)
So, we have a metric sentry3_total_power_watts and the value of 1075.
Now, let’s move to the Prometheus server and add a job. Edit /etc/prometheus/prometheus.yml configuration file, and add a job:
sudo vi /etc/prometheus/prometheus.yml

# Sentry 3 PDU
  - job_name: 'snmp_pdu'
    static_configs:
      - targets:
        - 192.168.1.30
        - 192.168.1.31
    metrics_path: /snmp
    scrape_interval: 30s
    params:
      module: [sentry3]
    relabel_configs:
      - source_labels: [__address__]
        target_label: __param_target
      - source_labels: [__param_target]
        target_label: instance
      - target_label: __address__
        replacement: 192.168.0.162:9116
In this job I use two targets – IP addresses of two PDUs. In the replacement value, put an IP address of the Prometheus SNMP Exporter, and in the params, we specify the module we want to use.
Restart Prometheus, and it will scrape metrics from the SNMP devices using snmp-exporter.
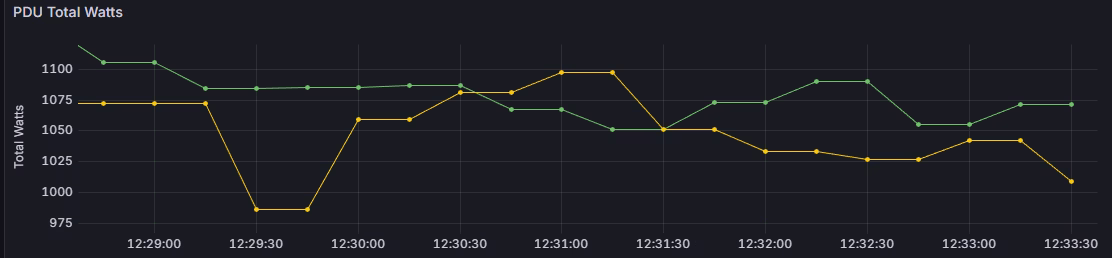
Now you can connect a data source to Grafana and create a power usage graph.
![]()