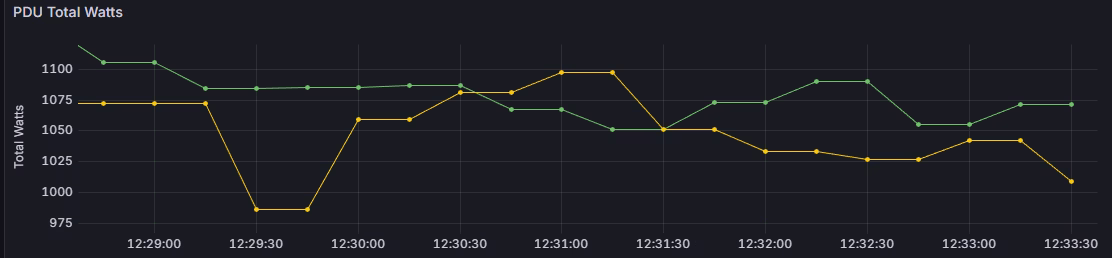
Recently I’ve been asked to create a dashboard in Grafana, displaying the power usage of the Smart PDU Sentry3.
Although most of the modern systems have a metric page or a written exporter, which can be simply gathered by Prometheus, most of the old systems or devices are still answering SNMP queries and do not have exposed metrics or an exporter.
In this situation we can use the Prometheus SNMP exporter, which acts like a proxy between Prometheus and the SNMP device. The Prometheus SNMP exporter exposed metrics to the Prometheus server based on the SNMP queries to the requested device.
Continue reading ![]()